Create your own scenario for a low carbon society by 2050

...

...

...

...


THE CHALLENGE

HOW TO USE

GO AHEAD

MATERIAL FOR
TEACHERS
TEACHERS

Contactez-nous
Disclaimer
Disclaimer
Our partners

| The educational web tool 'My2050' is an initiative of the Climate Change Section of the Federal Public Service Health, Food Chain Safety and Environment. | |||

|
Strategic advice and energy/emissions modelling
www.climact.com | |||
|
Programming and design of the web tool (including the animated landscape) www.climatemediafactory.de | |||

|
Development of 7 video-animations (excluding the animated landscape) www.cronos.be www.legioen.tv | |||

| ||||
|
Development of the 'Manual for teachers', testing and promotion within schools www.wwf.be | |||
My scenario - results in a glimpse
| GHG emission reductions | Energy consumption | Costs indicators | Details of my scenario |
These graphs show the emissions and the emission reductions in 2050 as a result of your scenario, compared to the emission levels in 1990 (the official reference year for emissions) and the reference scenario (in which all levers are set at level 1).
| GHG EMISSION REDUCTIONS IN 2050 (compared to the level in 1990) | |||||||||||||||||||||||||||||||||||||||||||
| |||||||||||||||||||||||||||||||||||||||||||
| |||||||||||||||||||||||||||||||||||||||||||
| ENERGY CONSUMPTION IN 2050 (compared to the level in 2010) | |||||||||||||||||||||||||||||||||||||||||||
| |||||||||||||||||||||||||||||||||||||||||||
Lorem ipsum dolor sit amet, consetetur sadipscing elitr, sed diam nonumy eirmod tempor invidunt ut labore et dolore magna aliquyam erat, sed diam voluptua. At vero eos et accusam et justo duo dolores et ea rebum. At vero eos et accusam et justo duo dolores et ea rebum.
At vero eos et accusam et justo duo dolores et ea rebum. At vero eos et accusam et justo duo dolores et ea rebum. Stet clita kasd gubergren, no sea takimata sanctus est Lorem ipsum dolor sit amet. At vero eos et accusam et justo duo dolores et ea rebum. At vero eos et accusam et justo duo dolores et ea rebum.
| COSTS INDICATORS (average yearly system costs - undiscounted 2010-2050, in million EUR) | ||||||||||||||||||||||||||||||||||||
| ||||||||||||||||||||||||||||||||||||
hide COSTS
| COSTS INDICATORS (average yearly system costs - undiscounted 2010-2050, in million EUR) | ||||||||||||||||||||||||||||||||||||
| ||||||||||||||||||||||||||||||||||||


BACK
COMPARE
SUBMIT
SHARE YOUR SCENARIO
Share
your scenario
with others
Here you can share
the individual scenario
you have created.
the individual scenario
you have created.

My scenario for 2050
| Lever | Level | Description | |||
| TRANSPORT: Behaviour | 4 |
Transport demand per person: -20% Occupancy rate: cars +15%, buses +50%, trains +33%. Proportion of the different means of transport: 55% per car, 25% per bus and coach, 13% per rail, 6% on foot or by bike. | |||
| TRANSPORT: Technology | 4 |
Passenger transport:
Energy efficiency: car combustion engines +50%, plug-in hybrid cars +50-55%, electric cars +55%; all types of buses +30%, diesel trains +40% and electric trains +30%; Engine types: 100% electric cars (80% battery-powered, 20% fuel cell-powered); buses 45% plug-in hybrid and 35% electric (30% battery-powered, 5% fuel cell-powered).
Goods transport: Energy efficiency: diesel-powered lorries +35%; diesel trains +40% and electric trains +30%; Engine types: lorries 35% diesel (hybrid), 45% CNG (hybrid) and 20% electric; trains 10% diesel and 90% electric; Transport modes: 55% via road, 20% via rail, 25% via inland waterways. | |||
| BUILDINGS: Behaviour | 4 |
Homes: Proportion of apartments in new homes: 40%; Average indoor temperature: 20°C; demand for domestic hot water: +20%.; 60% have air-conditioning; Electricity demand: lighting -40%, white goods stable, brown goods +12.5%.
Trade premises/offices: Energy demand for heating and cooling: 2.3% average annual increase up to 2020, then 1.8% average annual increase (2030-2050); Electricity demand: lighting +7%, equipment +131%. | |||
| BUILDINGS: Technology | 4 |
Homes: As a result of renovations, heating demand from existing buildings decreases from 140 to 30 kWh/m² in 2050; energy demand from new homes steadily decreases to the passive house standard (15 kWh/m²) from 2020. Heating systems: 85% heat pumps (electric); 40% share of alternative technologies in non-electrical systems.
Trade premises/offices: Heating demand decreases by 85%. Heating systems: 85% heat pumps; 40% share of alternative technologies in the non-electrical systems. 50% have air conditioning, but the increase in passive cooling systems leads to a 90% decrease in the energy demand for cooling. | |||
| INDUSTRY: Production | 4 |
Lorem ipsum dolor sit amet, consetetur sadipscing elitr, sed diam nonumy eirmod tempor invidunt ut labore et dolore magna aliquyam erat, sed diam voluptua. At vero eos et accusam et justo duo dolores et ea rebum. At vero eos et accusam et justo duo dolores et ea rebum. Stet clita kasd gubergren, no sea takimata sanctus est Lorem ipsum dolor sit amet. At vero eos et accusam et justo duo dolores et ea rebum. At vero eos et accusam et justo duo dolores et ea rebum. | |||
| INDUSTRY: Carbon intensity | 4 |
Lorem ipsum dolor sit amet, consetetur sadipscing elitr, sed diam nonumy eirmod tempor invidunt ut labore et dolore magna aliquyam erat, sed diam voluptua. At vero eos et accusam et justo duo dolores et ea rebum. At vero eos et accusam et justo duo dolores et ea rebum. Stet clita kasd gubergren, no sea takimata sanctus est Lorem ipsum dolor sit amet. At vero eos et accusam et justo duo dolores et ea rebum. At vero eos et accusam et justo duo dolores et ea rebum. | |||
| INDUSTRY: CCS | 4 |
Lorem ipsum dolor sit amet, consetetur sadipscing elitr, sed diam nonumy eirmod tempor invidunt ut labore et dolore magna aliquyam erat, sed diam voluptua. At vero eos et accusam et justo duo dolores et ea rebum. At vero eos et accusam et justo duo dolores et ea rebum. Stet clita kasd gubergren, no sea takimata sanctus est Lorem ipsum dolor sit amet. At vero eos et accusam et justo duo dolores et ea rebum. At vero eos et accusam et justo duo dolores et ea rebum. | |||
| ENERGY: Wind & solar | 4 |
Wind energy: capacity on land increases to 13 GW (installation of 460 MW or 180 turbines per year), at sea to 16.5 GW (+ 600 MW or 100 turbines per year).
Solar energy: photovoltaic capacity increases to 50 GW (average + 1,400 MW per year in 2010-2050), thermal capacity gradually increases to an average of 5m² per household. | |||
| ENERGY: Hydro & geothermal | 4 |
Hydroelectricity: 150 MW in 2050 (an increase of 40 MW).
Geothermal electricity: an installed capacity of 500 MW in 2025, increasing to 6 GW in 2050. | |||
| ENERGY: Import | 4 | To meet demand in 2050, Belgium imports maximum 17 TWh (which is 20% of the domestic production of 84 TWh in 2010). | |||
| ENERGY: Biomass | 4 |
Production in Belgium: 33 TWh in 2020 followed by an increase to 45 TWh in 2050.
Imports: gradual increase to 20 TWh in 2020 and 56 TWh in 2050. Share in electricity production: 60% | |||
| AGRICULTURE: Diet | 4 | With continuing population growth and a change made to consumption patterns: decreased meat consumption and a 43% (approx. 24 million animals) drop in animal numbers. | |||
| AGRICULTURE: Technology | 4 |
Methane: emissions decrease per animal by 16% in 2050 in comparison to 2010. Nitrogen from dung (per animal): slight annual decrease (- 3.2%) until 2030 in comparison to 2010, followed by stabilisation until 2050 (due to increased productivity). Emissions 47% lower in 2050. Nitrogen from soil: slight annual decrease (- 0.5%) per hectare until 2030 in comparison to 2010, followed by stabilisation until 2050. Emissions 10% lower in 2050 in comparison to 2010. | |||
Submit your scenario
Compare your own 2050 scenario with others
bubble-graph-intro
Details on the positioning of scenarios in the chart ...

| : | : 'your' scenario | ||

| : | : other saved scenarios. The size of the bubble increases with the amount of saved scenarios with the same reduction target. | ||

| : | : scenarios of a number of VIPs | ||

| : | : 4 sample scenarios deriving from the Study on 'Scenarios for a Low Carbon Belgium by 2050' |
|
How is the position of your scenario in the chart calculated ? | ||||||
The position of your scenario in the chart is determined by two parameters:
|
1/ the average of the technological levers. This is the average of:
|
2/ the average of the 3 specific behaviour levers:
| ||||



















1990

-80%

-95%

-XX%

No net
electricity
imports
electricity
imports

Go to your
results
results
viour
logy
| TRANSPORT |
viour
logy
| BUILDINGS |
tion
intensity
capture
| INDUSTRY |
solar
& hydro
electricity
mass
| ENERGY |
logy
| AGRICULTURE |
XXXXXXXXXXXXXXXXXXXXXX
XXXXXXXXXXXXXXXXXXXXXX
XXXXXXXXXXXXXXXXXXXXXX

◀
| SECTOR-NAME - | LEVER-TITLE |
| |||||||||
| SECTOR-NAME - | LEVER-TITLE |
| |||||||||
|
XX This lever allows you to reduce the energy consumption of passenger transport by selecting the ambition level of behavioural choices in 3 areas:
|
|
|
| SECTOR-NAME - | LEVER-TITLE |
| |||||||||
|
XXX
|
|
| |||||||||||||||||||||||||||||||||||||||||||||||||||||||||||||||||||||||
| SECTOR-NAME - | LEVER-TITLE |
| |||||||||
| SECTOR-NAME - | LEVER-TITLE |
| |||||||||
| SECTOR-NAME - | LEVER-TITLE |
| |||||||||
|
XXX
XXX * MtCO2eq: stands for megaton (million ton) CO2-equivalents. The greenhouse gasses CO2, CH4, N2O, ... have each a different 'warming potential'. To take into account their relative contribution to the total emissions, their respective concentration is converted into one single unit (CO2-equivalents).
XXX ** Production levels: see further information in the 'Production in Industry' information sheet CCS: a technology for carbon capture and storage at the source (see the following information sheet).
|
|
|
| SECTOR-NAME - | LEVER-TITLE |
| |||||||||
| SECTOR-NAME - | LEVER-TITLE |
| |||||||||
| SECTOR-NAME - | LEVER-TITLE |
| |||||||||
| SECTOR-NAME - | LEVER-TITLE |
| |||||||||
| SECTOR-NAME - | LEVER-TITLE |
| |||||||||
| SECTOR-NAME - | LEVER-TITLE |
| |||||||||
| SECTOR-NAME - | LEVER-TITLE |
| |||||||||
| XXX |
| |||||||||
|
XXX
|
|
|
|
|
TRANSPORT -
Technological solutions | This slider comprises various technological changes in the transport sector for passengers and goods. It concerns a reduction in energy consumption per kilometre (an improvement in efficiency) and the shift to a hybrid or fully electric drive for the vehicles. |

|
|
1/ Increasing energy efficiency (reducing energy consumption per kilometre travelled): Greenhouse gas emissions from the transport sector can be decreased through significantly increasing engine efficiency. This means a vehicle can travel the same distance using less energy. The potential is great: depending on the level of ambition chosen, type of vehicle and engine, improved technologies can still increase energy efficiency by a further 10 to 55%.
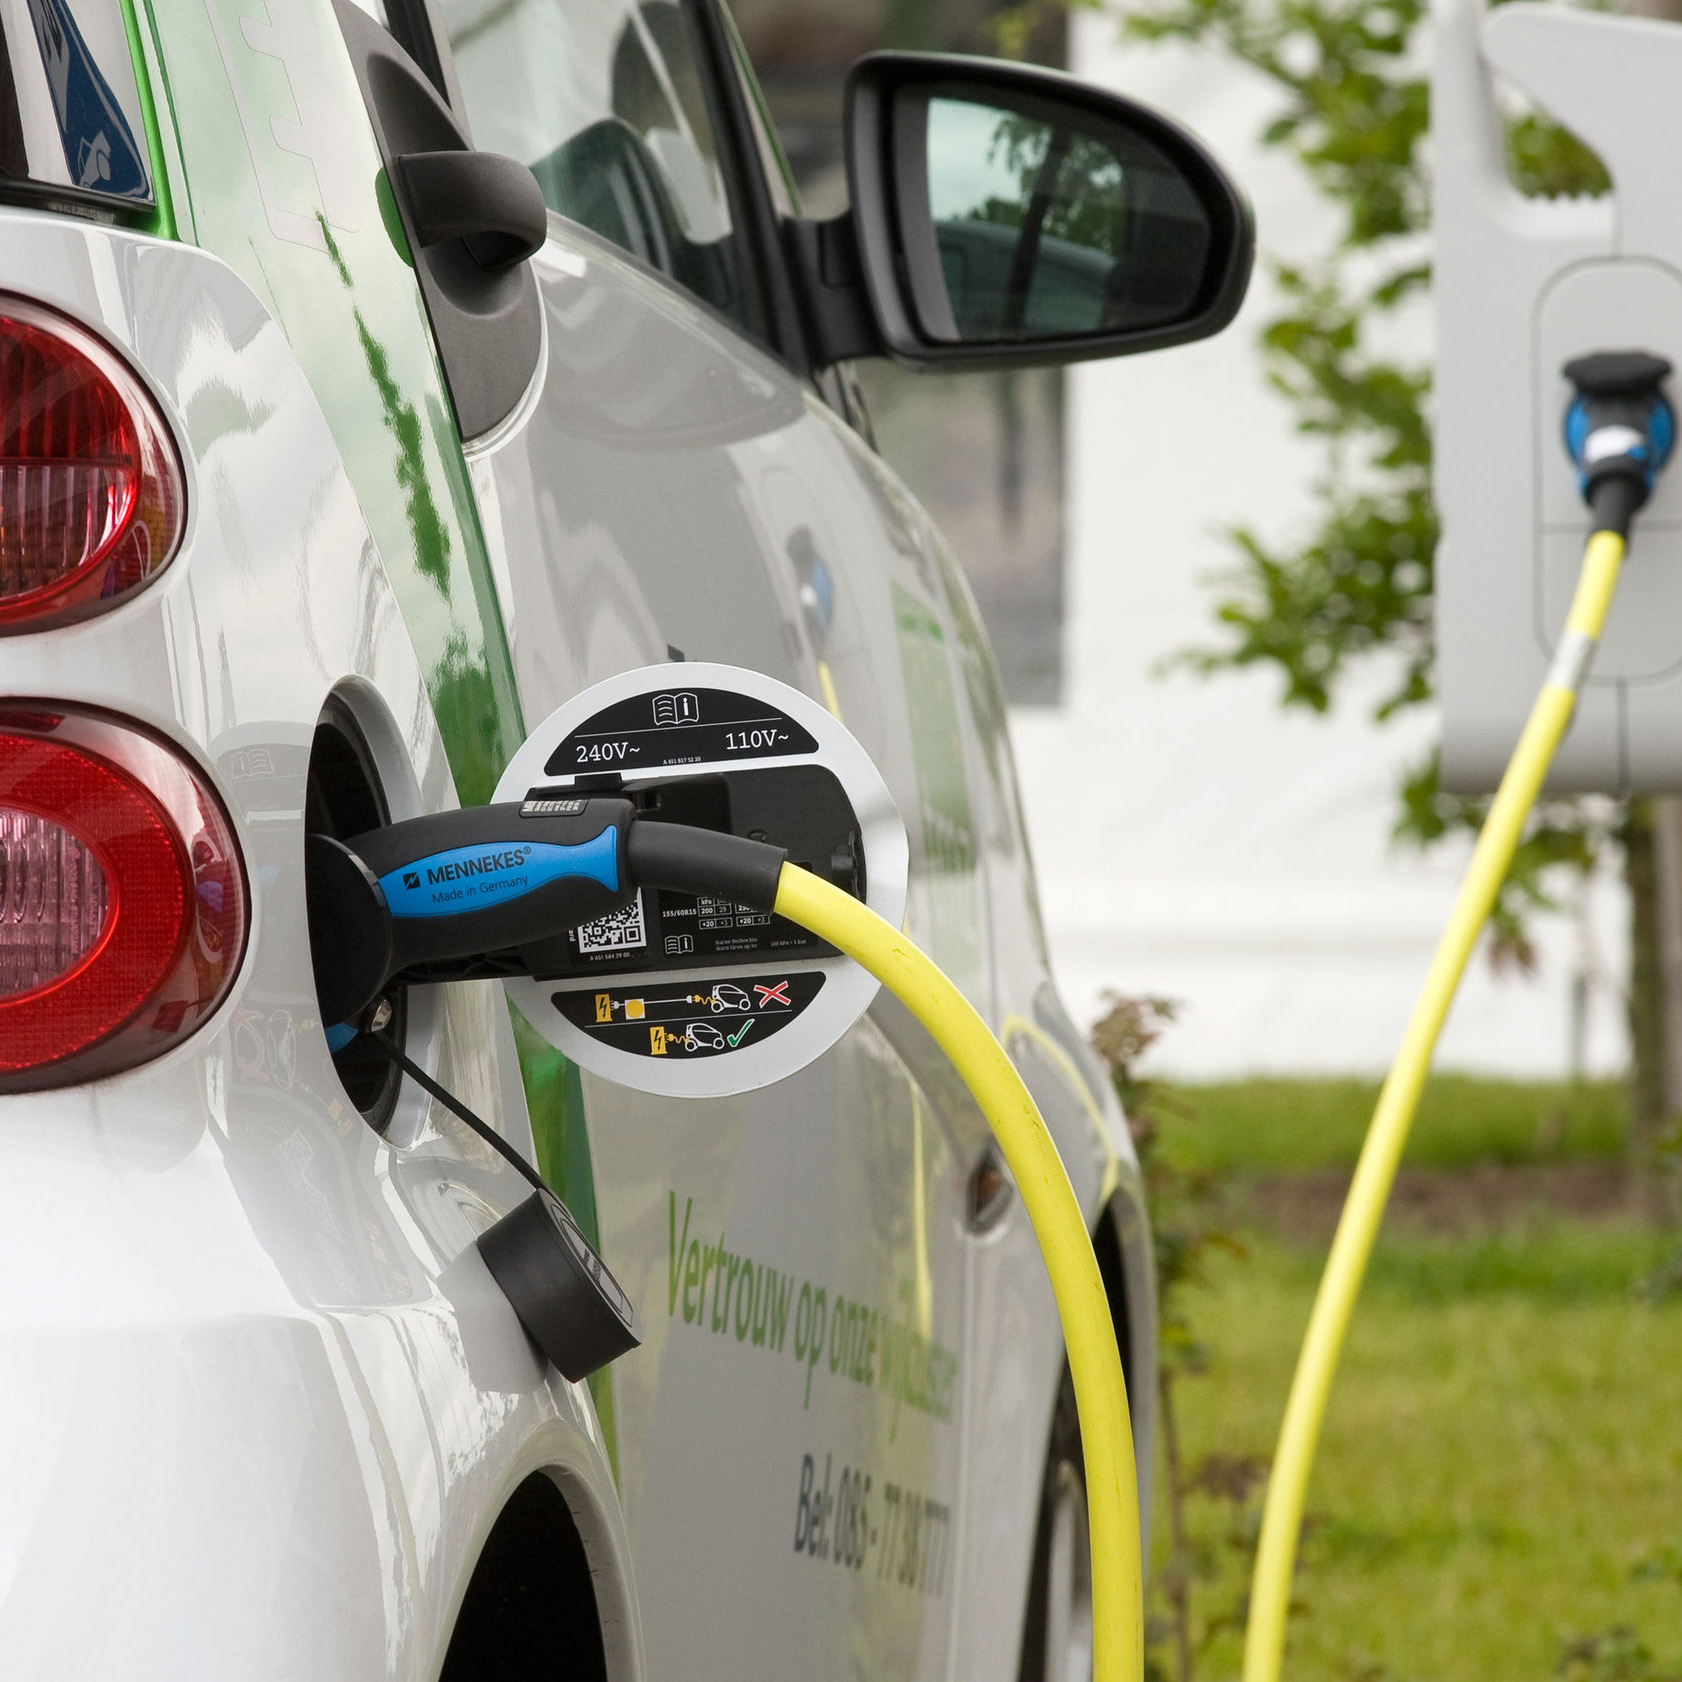
2/ Choosing other technologies (degree of electrification): his concerns a shift from a system based on fossil fuels to one based on electricity. Until recently, the proportion of diesel vehicles continued to increase, while the proportion of hybrid and electric vehicles has remained very limited. An increase in the proportion of hybrid or fully electric vehicles (operated by a battery or fuel cell) can result in a significant decrease in greenhouse gas emissions, provided that the production of this electricity emits few or no greenhouse gasses, for instance by means of renewable energy. Accordingly, electrification of the transport system must thus go hand-in-hand with the switchover to an electricity sector that does not cause greenhouse gas emissions. In the highest ambition level, the proportion of hybrid or 100% electric vehicles is up to 80% for cars, 45% for buses and lorries and 90% for trains. |
AMBITION LEVELS
| |||
|
|
|
BUILDINGS -
Behaviour at home and at work | This lever comprises a number of behavioural choices that can significantly influence energy consumption in a building (home or workplace): the nature of the building (for instance the surface area, apartment or fully detached house), the demand for heating or cooling and the choice and use of appliances and lighting. |

|
|
1/ The type of building: The energy consumption used to heat a building depends partly on the occupied area and the type of construction: individual homes - and certainly detached homes - usually consume much more energy than apartments. The proportion of apartments in the total number of new homes in Belgium is currently 53%. Depending on the level of ambition this proportion can decrease to 40% or rise to 77% in 2050. The latter can reduce the demand for heating enormously.
2/ The demand for heating and cooling (air-conditioning): If we consider all of the rooms together (including those unheated), the average temperature of our homes is currently 18°C. This average is expected to gradually increase to 20°C in 2050 if no additional measures are taken. Yet it is possible to get this average to drop to 16°C, for instance, by heating just the areas that are effectively in use and by maintaining a lower temperature in other rooms (bedrooms, attic, etc.) or through measures that promote efficient use of the heating (such as switching to a night temperature at the end of the evening or when absent). The demand for domestic hot water is also expected to increase by 20% in 2050 (compared to 2010) if no additional measures are taken. A decrease of 50% is nevertheless possible. Analogously, the use of air conditioning systems (now in 4% of homes) will increase sharply to 60% in 2050 if no additional measures are taken. This upward trend can also be avoided: ambition level 4 results in a stabilisation at 4% in 2050, namely at the same level as in 2010. 3/ The choice and use of appliances and lighting: There is still great potential for reducing the energy consumption of lighting, white goods (large white household appliances such as washing machines, dryers, refrigerators or freezers) and brown goods (electronic appliances such as TVs, audio equipment, etc.), both by purchasing energy-efficient models and using them judiciously. |
AMBITION LEVELS
| |||
|
|
|
BUILDINGS -
Technological improvements to buildings | This slider comprises a number of technological measures that can significantly reduce energy consumption in buildings (homes or work environment): a greater degree of insulation and environmentally friendly and efficient heating systems (heat pumps in particular). |

|
|
1/ A greater degree of insulation: Belgian homes are among the most inadequately insulated homes in Europe. Thorough roof, floor and wall insulation combined with the installation of high-yield glass can reduce heating demand of homes by 85% in 2050 (compared to 2010: the heating demand at that time was approx. 140 kWh/m²). With regard to new buildings, the rapid introduction of standards for low-energy housing (30 kWh/m²) and passive housing (15 kWh/m²) can make a significant contribution.
2/ More efficient heating systems: Improving the efficiency of heating systems and switching from systems based on fossil fuels (natural gas, heating oil), which emit greenhouse gases upon combustion, to more environmentally friendly types, can make an important contribution. There is an important role for electrically powered heat pumps, the share of which can increase to 20% and even as much as 85%, depending on the chosen ambition level. Additionally, innovative heating technologies such as district heating with micro-cogeneration and even geothermal heating, will see their share rise 10 to 40% in 2050. Please note: The choices related to the energy efficiency of household appliances and lighting take place via the 'behaviour' lever. |
AMBITION LEVELS
| |||
|
|
|
INDUSTRY -
Production in industry | This 'slider' is not - in contrast to the others - a lever with four ambition levels reflecting different policy choices, but a slider making it possible to test the effects of three alternative scenarios for the production level, for the different industrial sectors. |

|
|
The evolution of industrial production by 2050:
Although it is extremely difficult to predict the evolution of the production of different sectors in 2050, three scenarios were devised for each sector:
When starting to prepare your own low carbon scenario the slider stands at level B. After choosing the level of ambition for each of the other levers, you can assess the impact of the two alternative levels (levels A and C) and in this fashion, conduct your own 'sensitivity analysis'. Non-ETS: systems that are not covered by the EU Emissions Trading Scheme. |
AMBITION LEVELS
| ||
|
| |||
|
|
|
|
INDUSTRY -
Carbon intensity in industry | Greenhouse gas emissions from industry can be reduced with this lever by means of increased energy efficiency, switching over to energy sources with lower carbon intensity and through specific process improvements. |

|
|
Even if significant reduction in greenhouse gas emissions have occurred since several years in the industry, several possibilities to further reduce emissions by 2050 exist:
1/ Increasing energy efficiency (a reduction of energy consumption per unit produced). 2/ Switching to energy sources that emit less carbon per energy unit (reducing carbon intensity): Switching from coal or oil to solid biomass, natural gas or biogas, etc. reduces the quantity of greenhouse gases emitted per unit produced. 3/ Process improvements can also reduce energy consumption per unit produced: the steel sector for example can achieve this by developing a new technology (such as ‘the Hisarna-process’) for producing pig iron, or the chemical sector through recycling. By making full use of the three options, the emissions from industry in ambition level 4, can be reduced by more than 50% by 2050 in comparison with the reference level (defined in ambition level 1). All of these possibilities are very sector-specific and the possibility to reduce emissions consequently may differ greatly from sector to sector. |
AMBITION LEVELS
| |||
|
|
|
INDUSTRY -
Carbon Capture and Storage | Carbon Capture and Storage (or CCS) is a technology in which CO2 is captured 'at source' (at the place where it is produced), transported and stored in underground storage places to avoid these emission to enter into the atmosphere. This slider is used to select the degree to which this technology is applied in the industry by 2050. |

|
|
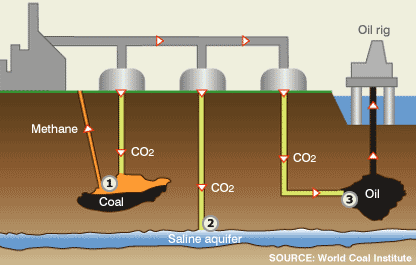
Carbon capture and storage (CCS) can be applied to industry as well as to the generation of electricity. This slider is used to determine to what extent the application of this technology could be necessary in the industry in order to achieve very ambitious emissions reductions. In electricity production, this tool does not take CCS into account because lots of other options exist for generating electricity in a climate-friendly way.
The use of carbon capture and storage (CCS) in industry: You can opt not to use CCS (in ambition level 1) or opt to provide all industrial sites with this technology above a certain emission level (the ceiling is proportioned opposite to the ambition level of the slider). Even though the technology is currently still in its infancy and has not yet been successfully applied to large-scale industrial sites, the tool is based on the principle that all industrial systems in energy-intensive sectors could be equipped with this technology. Unlike the results from investments made in energy efficiency and process improvements, with this technology greenhouse gas emissions are not avoided, CO2 production remains the same, but the majority of it does not end up in the atmosphere. The technology albeit requires additional energy in order to absorb and store the carbon. |
AMBITION LEVELS
| |||
|
|
|
ENERGY -
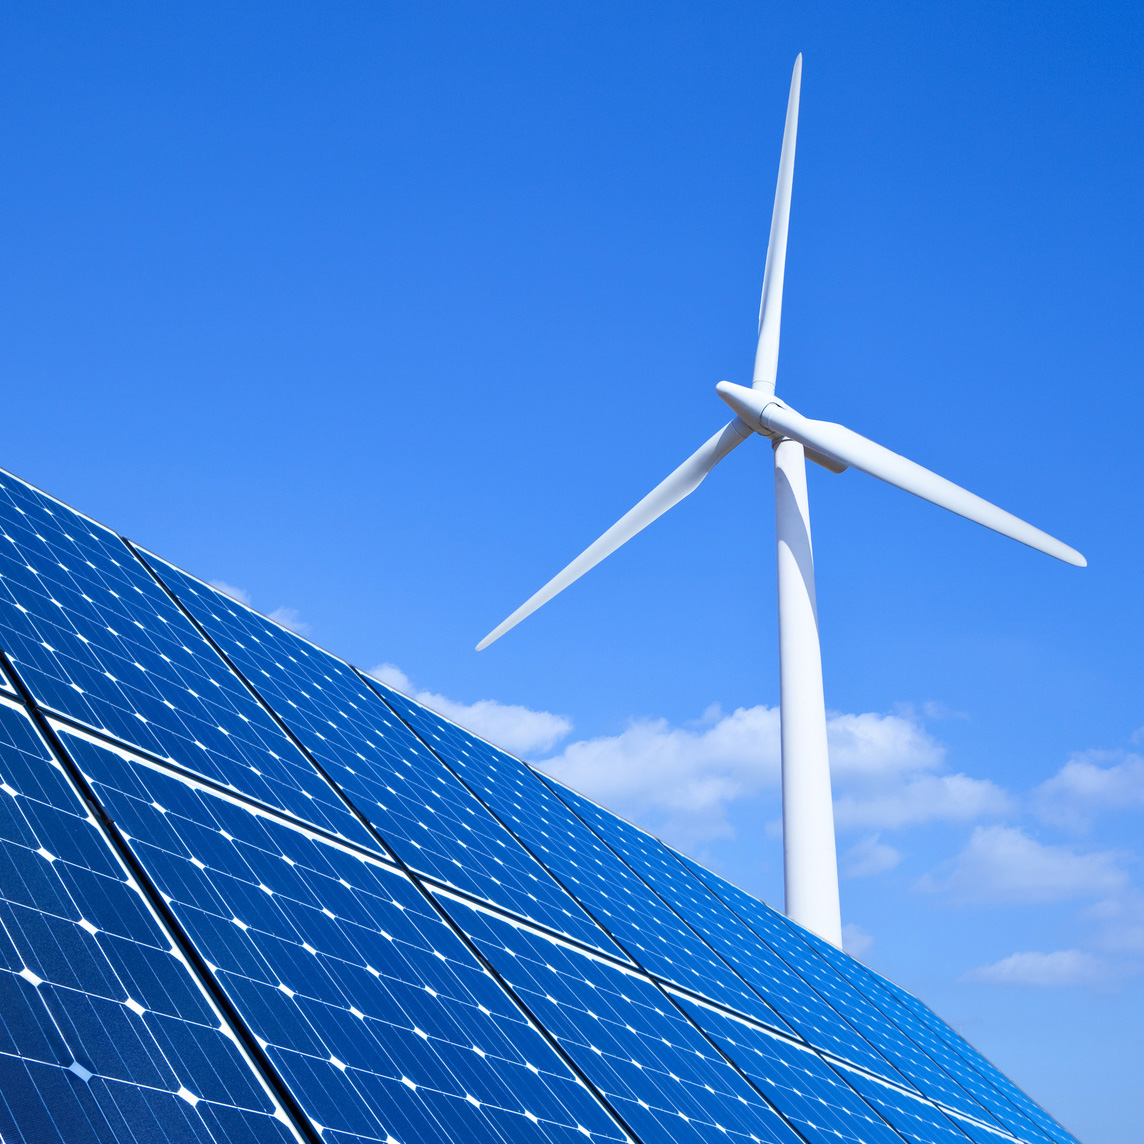
Wind & solar energy | This lever is used to determine the total production capacity - in 2050 - of wind turbines (at sea and on land) and solar panels (photovoltaic panels to generate electricity and thermal panels that absorb heat from sunlight for domestic hot water or heating of the building). |

|
|
Wind and solar energy are two natural, renewable resources that generate electricity or heat with no greenhouse gas emissions. The deployment of these resources is thus vital if fossil fuel use and, consequently, greenhouse gas emissions are to be considerably reduced.
However, these technologies do not produce energy continuously: their production depends on the quantity of wind or sun available, which is why they are called 'intermittent energy sources'. Depending on the chosen ambition level, the installed capacity will increase as follows:
|
AMBITION LEVELS
| |||
|
|
|
ENERGY -
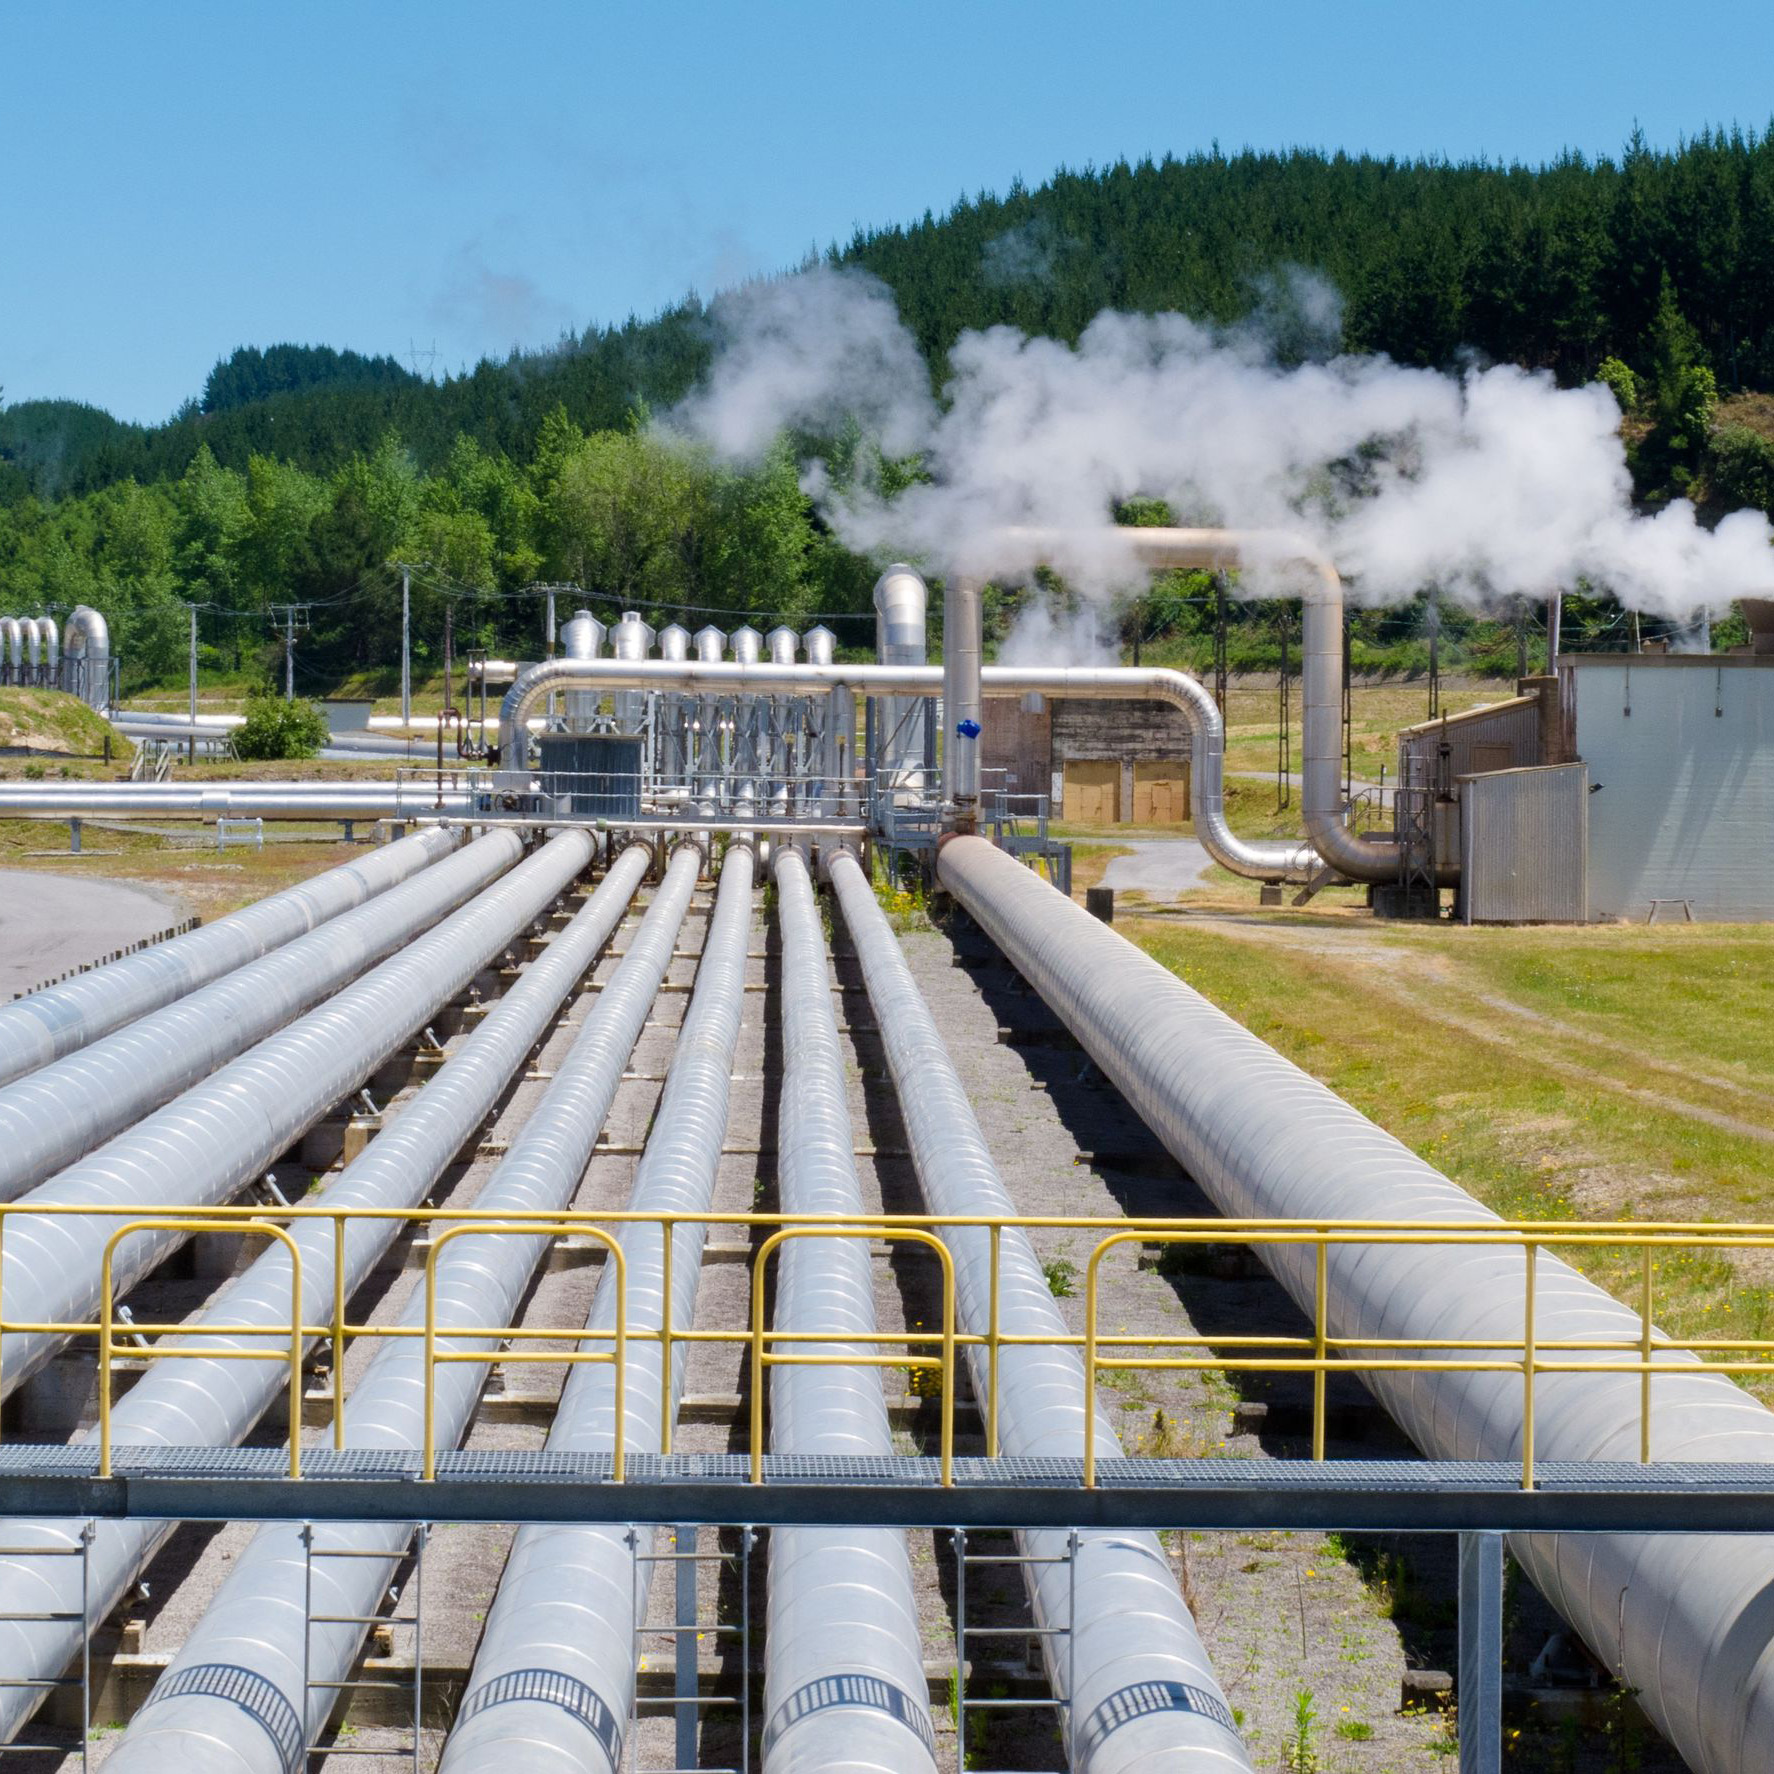
Geothermal and hydro-electricity | This lever is used to determine the quantity of electricity that will be generated in 2050 by geothermal power stations (which draw heat from underground) and hydroelectric power stations (hydroelectricity).of the building). |

|
|
While wind turbines and solar panels are 'intermittent' sources of renewable energy (their production depends on the amount of sun and wind), geothermal and hydroelectric power are constantly available.
Geothermal power stations use heat from deeper ground layers to generate electricity. The installed capacity remains virtually non-existent at ambition level 1. At ambition level 4 it could gradually climb to 500 MW* in 2025 and 6 GW* in 2050. Hydroelectric power stations use the energy of running water, either directly (for instance, by placing a water wheel in a water course), or by building a dam in which the accumulated water is led over a turbine. Our country has a current capacity of 110 MW** from hydroelectric power, primarily in Wallonia. This capacity remains unchanged at ambition level 1 and at ambition level 4 gradually climbs to 150 MW in 2050 (an increase of 40 MW in 2050). * A capacity of 1 GW (gigawatt) is equal to 1,000 MW (megawatts) or 1 million kW (kilowatts), and is equivalent to the capacity of a recent Belgian nuclear power station such as Doel 4. ** 1 MW (megawatt) = 1,000 kW (kilowatts). |
AMBITION LEVELS
| |||
|
|
|
ENERGY -
The import of electricity | Our country transports electricity in and out on a daily basis via power lines connecting our network with those of neighbouring countries and balancing the demand and supply of electricity. This lever is used to determine the net amount of net imports of electricity from neighbouring countries in order to meet our own demands in 2050. |

|
|
Not every kilowatt-hour of electricity consumed in Belgium needs to be produced per definition in Belgium: electricity can be imported from neighbouring countries. Taken on an annual basis, in the last two decades our country has imported almost every year more electricity than it has exported, up to 10% of total consumption.
Depending on the chosen ambition level, we choose a situation involving no net import (electricity imports are equal to electricity exports on an annual basis) with maximum net import of 17 TWh* in 2050, which is equivalent to 20% of Belgium's production of 84 TWh in the reference year 2010. It is obviously possible that this selected quantity will not (entirely) be necessary if for instance a sufficient amount of electricity is produced within national borders. In the context of a low-carbon Europe by 2050, it is assumed that all imported electricity will be carbon free, originating from renewable energy sources, nuclear energy or plants operating on fossil fuels fitted with carbon capture and storage technology (CCS). Note: Within the European Union we are striving for the expansion of an integrated European electricity network with cross-border transmission lines in view of facilitating exchanges in order to balance supply and demand of electricity at European level. Due to its central and strategic location within Europe, our country can even become a very important player in this European electricity network. * 1 TWh (terawatt-hour) is equivalent to 1.000 GWh (gigawatt-hour), 1 million MWh (megawatt-hour) or 1 billion kWh (kilowatt-hour), or the annual consumption of almost 300.000 households (based on an average annual consumption of approximately 3,500 kWh per household). |
AMBITION LEVELS
| |||
|
|
|
ENERGY -
The use of biomass | This lever is used to determine the ambition level for the use of biomass: it is used to choose both the volume of domestic production and imports. |

|
|
Biomass is organic material which can be used as an energy source, via combustion (wood or pellets), after fermentation to produce biogas, or after chemical conversion (rapeseed, palm oil, etc.) into biofuel. This renewable energy source is considered 'climate neutral' because the CO2 released during combustion is first absorbed by the plants during their growth period (through photosynthesis). Biomass can be used to produce heating, electricity or fuel for engines.
Unlike the intermittent energy sources of wind and solar energy, biomass is a very flexible renewable energy source. On the other hand, its uncontrolled production can cause damage both to the soil and biodiversity and affect local resources and food prices. In this tool, we proceed on the principle that the global potential of the 'sustainable' biomass (that has no such impact) used for power generation, is strictly limited, and is distributed equally between all of the planet's inhabitants. Consequently, a maximum amount (in ambition level 4) of 100 TWh* is allocated to our country in 2050 (partly produced in Belgium, partly imported). 1/ Domestic production of biomass: The potential for this production is estimated to be 27 to 45 TWh*. 2/ Biomass imports: Since the surface area available for the production of biomass is relatively limited in our country, all ambition levels anticipate a significant level of imports of biomass (30 to 56 TWh*). * The production or consumption of 1 TWh (terawatt-hour) is equivalent to 1,000 GWh (gigawatt-hour), 1 million MWh (megawatt-hour) or 1 billion kWh (kilowatt-hour), or the annual consumption of almost 300.000 households (based on an average annual consumption of approximately 3,500 kWh per household). |
AMBITION LEVELS
| |||
|
|
|
AGRICULTURE -
Beha-viour | This lever is used to determine the ambition level for a behavioural change related to diet and meat consumption in particular. Reduced meat consumption implies a smaller livestock population which in turn leads to reduced greenhouse gas emissions in the agriculture sector. |

|
|
Technological improvements made in the agricultural sector have a relatively limited impact on greenhouse gas emissions. In contrast, behavioural changes can have a sizable impact. These are even necessary according to the World Health Organization, which states that the current average meat consumption is too high. The national nutrition plan indicates that a healthy diet contains 75 to 100 grams of meat, fish, eggs (and meat substitutes) per person per day whereas the average Belgian consumes approximately twice as much.
Livestock is responsible for a large share of the greenhouse gas emissions: l, via enteric fermentation (mostly by ruminants, such as cows, sheep and goats) and their dung, large quantities of methane are released into the atmosphere . Although nitrogen is mainly released via soil emissions, a smaller quantity is released via the dung. Methane and nitrogen are particularly strong greenhouse gases characterised by warming capacities that are respectively 20 and 310 times higher than that of CO2! Size of the livestock population: In 2010, the livestock population amounted to almost 42 million animals. Without a change into diets (ambition level 1) and taking into account rising human population growth, the livestock population will have grown by 2% to approximately 43 million animals by 2050 in comparison with 2010. In case of major behavioural changes (ambition level 4), meat consumption will drop and by 2050 livestock numbers will have dropped by roughly 43% (roughly amounting to 'just' 24 million animals). Note: Our country undertakes very intensive cattle breeding, almost half of this is intended for export. The latter could mean that a significant degree of meat production will still exist in Belgium when Belgians initiate and introduce thorough changes to their consumption patterns. However, the model assumes that consumption patterns in countries that Belgium exports to will undergo the same development as that experienced in Belgium. |
AMBITION LEVELS
| |||
|
|
|
AGRICULTURE -
Technology | This lever comprises a number of technological measures that could reduce livestock and soil emissions of methane and nitrogen: the emission of these greenhouse gases can be reduced through a balanced feeding programme for livestock in combination with improved manure and soil management. |

|
|
1/ Methane emissions: Methane gas (CH4) is emitted in relatively small quantities, however it is a greenhouse gas with a warming potential that is more than 20 times higher than that of CO2. Emissions primarily originate from enteric fermentation (particularly among ruminants: cows, sheep, goats, etc.): emissions vary in accordance with weight and feed and can be stabilised by 2050 through improved feeding programme management and optimal rationing. Dung also leads to methane emissions: these can be driven down through increased productivity (fewer animals for the same amount of meat), better dung management techniques and more anaerobic fermentation. Depending on the chosen ambition level, total methane emissions increase by 8% (level 1) per animal or decrease by 16% (level 4).
2/ Nitrogen emissions: Laughing gas or nitrous oxide (N2O) is emitted in relatively small quantities, however it is a greenhouse gas with a warming potential that is 310 times higher than that of CO2. It is mainly emitted in the soil from chemical processes originating from the fertilisation with dung and fertilizers, but also for a part directly from the manure of livestock. It is also emitted in the soil from the decomposition of organic material. Emissions originating from the soil can drop (to -10% at ambition level 4) through improved and more efficient fertilisation of fields. N2O emissions originating from dung can drop (to -47% per animal with ambition level 4) through higher productivity, more anaerobic fermentation and good dung processing techniques. (*) Note on chart 1 (top right): MtCO2eq: stands for megaton (million ton) CO2-equivalents. Greenhouse gasses (CO2, CH4, N2O, ...) have each a different 'warming potential'. To take account their relative contribution to the total emissions, their respective concentration is converted into one single unit (CO2-equivalents). |
AMBITION LEVELS
| |||
|


